Resources Category

IMPACT 2024
Redefine new possibilities in search advertising.
Sept. 17-18, 2024
Location:
New York, NY

There are many, many options for measuring marketing performance. At the most basic level, marketers divide revenue by marketing spend to determine ROI. The resulting metric, ROAS (Return on Ad Spend), is easy to calculate, easy to explain, easy to trend over time, and easy to compare across channels. This metric sets expectations for team performance, centers business discussions with the finance team, and supports investment decisions.
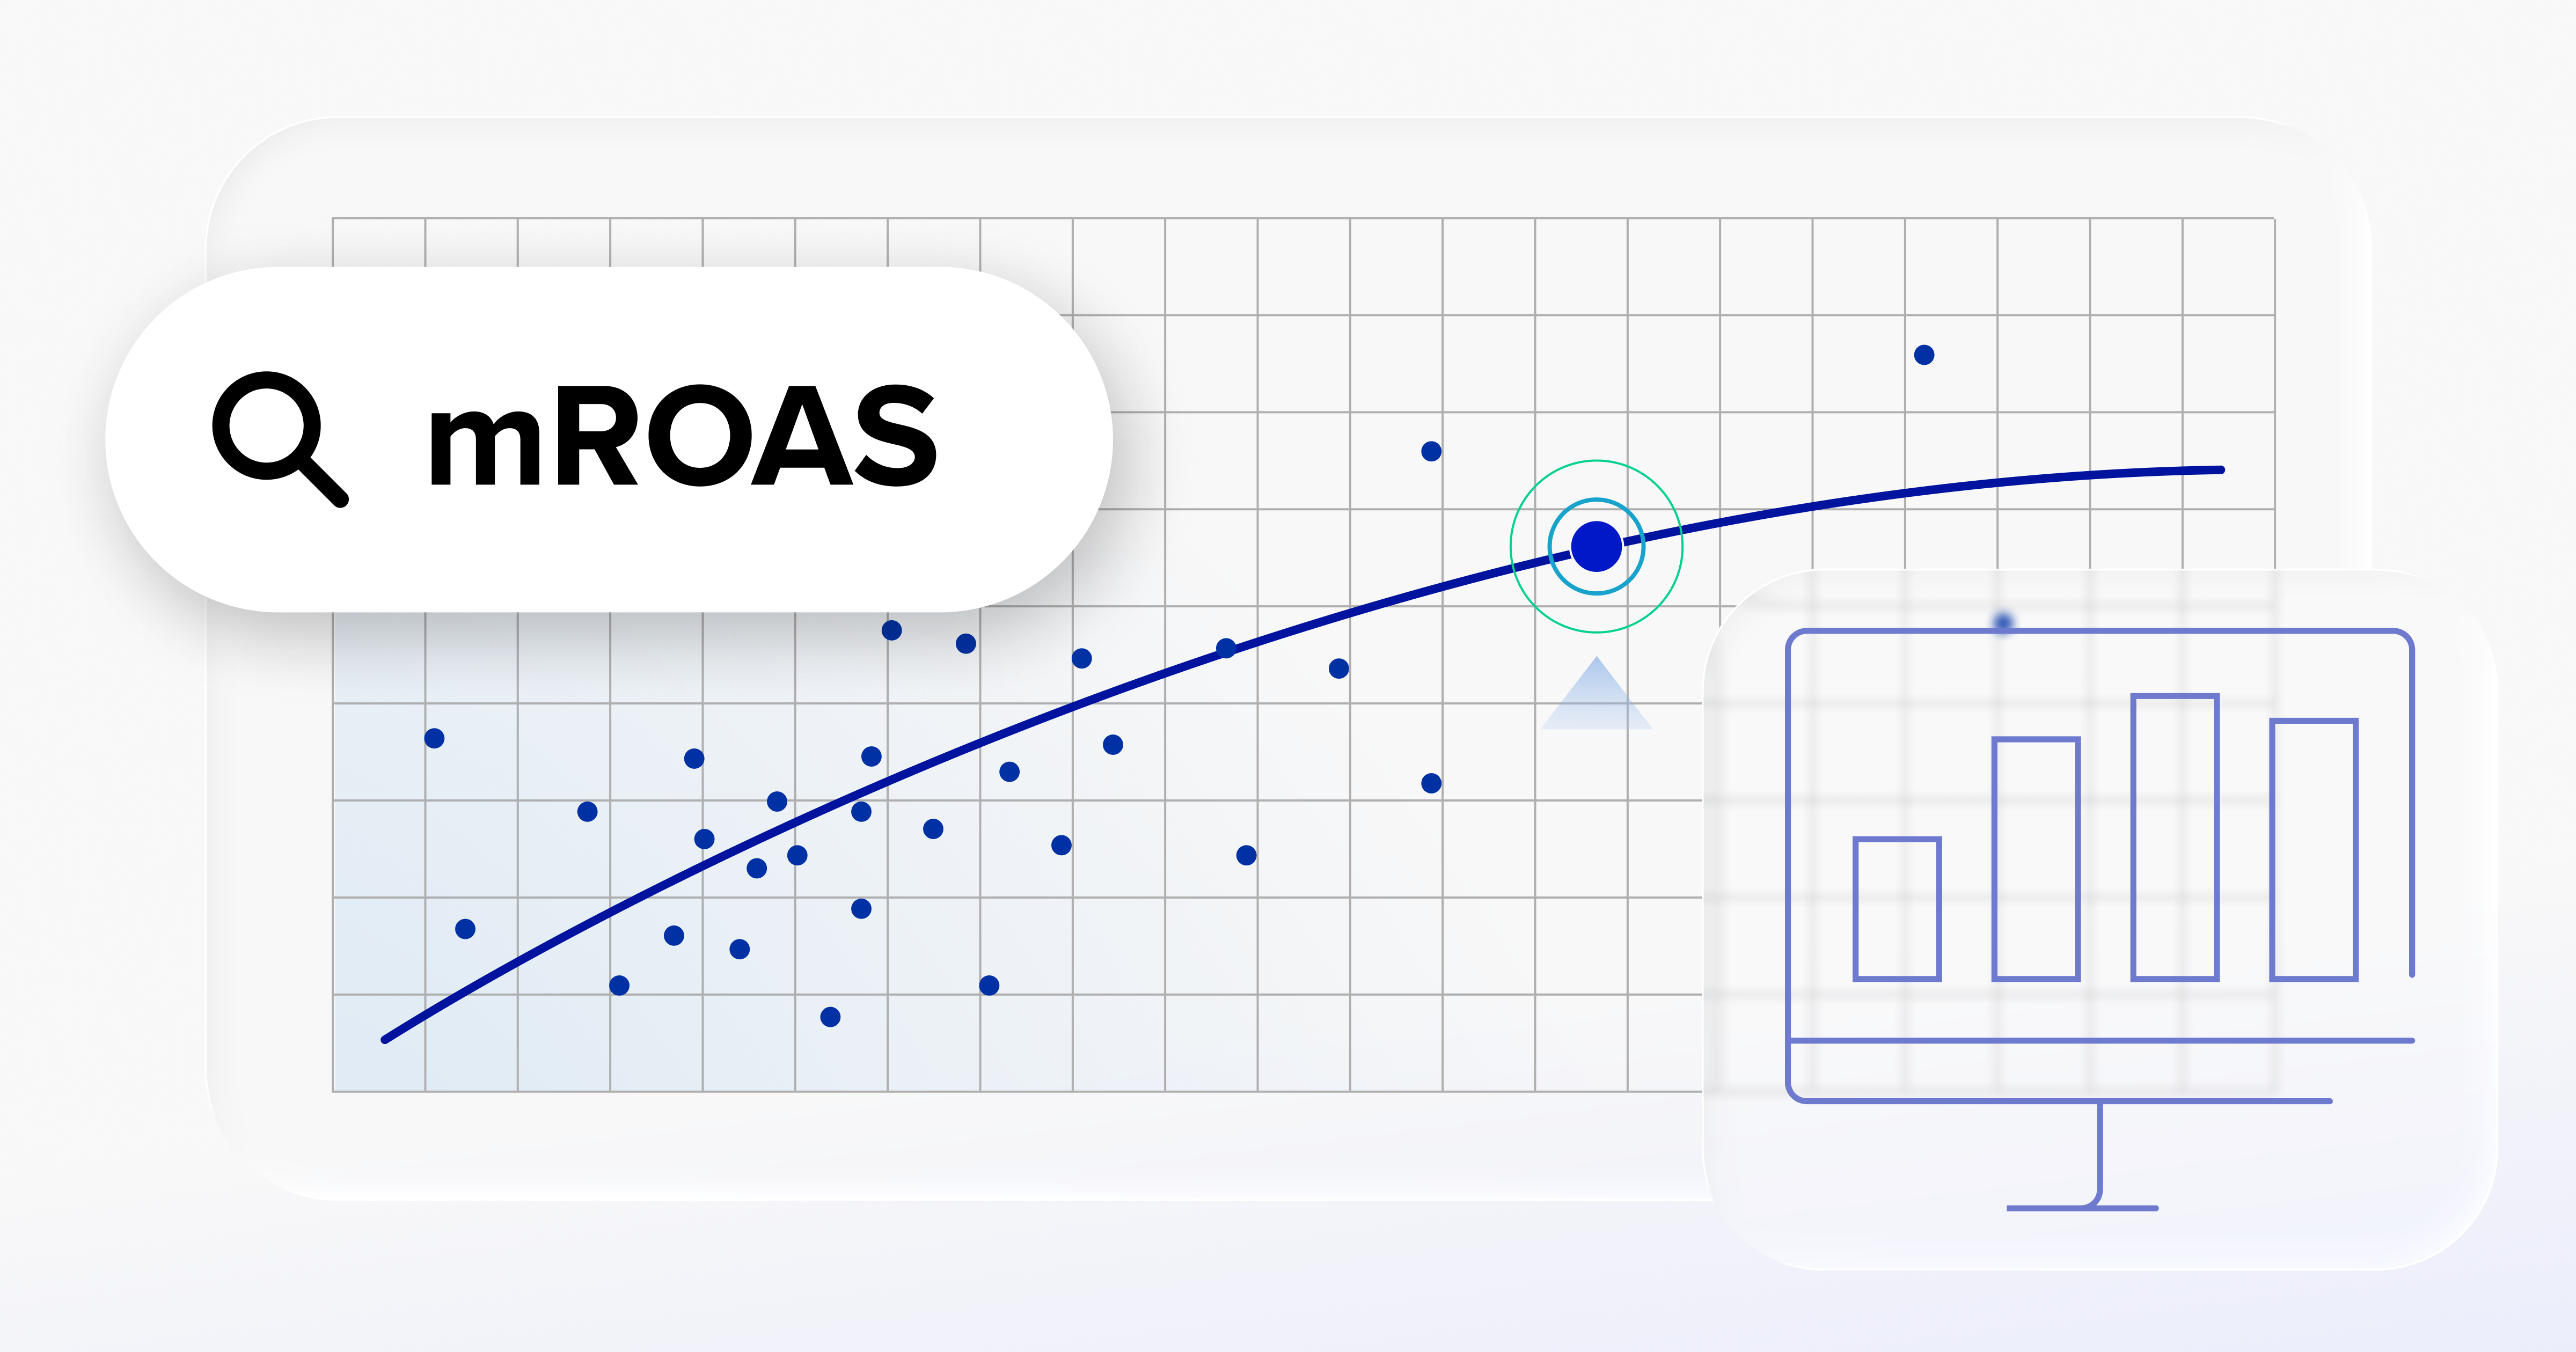
While ROAS explains the extent to which marketing spend is associated with revenue, it cannot explain the efficiency of that spend. To fill this knowledge gap and support more complex conversations, marketing teams must turn to ‘marginal ROAS’ (mROAS) — a metric that helps quantify revenue impact from incremental marketing investment.
A Brief Primer on mROAS
mROAS provides insight into peak spend levels and enables smarter investment decisions by surfacing when additional spend becomes inefficient. This empowers marketers to scale their advertising investments and bend the curve of diminishing returns.
Specific mROAS use cases include:
- Finding the optimal budget, where returns are strong but not wasteful (i.e., How much additional revenue will we generate from the next dollar we spend on marketing?)
- Pinpointing the breakeven point for revenue efficiency
- Identifying optimal investment in a given channel or campaign to avoid overspending, which dilutes overall ROI
- Making informed decisions on incremental investment opportunities
- Reallocating resources from underperforming channels to more effective ones
While mROAS provides directional insights, it cannot fully inform incrementality or iROAS measurement. Marketers need to either use in-market tests or models to understand the impact of the channel’s spend on revenue and report accurately on lift.
mROAS, Diminishing Returns, & Elasticity in Practice
Marketing teams buy impressions (ads) to build awareness and connect with potential customers in pursuit of a conversion. At first, the marketing spend dollars are highly effective: each dollar generates a strong return in revenue (a high ROAS). This is the growth phase, where marketing investments tend to work efficiently.
When ROAS is strong, marketers are incentivized to continue investing. However, as marketing spend increases, it’s inevitable that saturation kicks in and revenue growth slows down. In weekly reports, marketing teams will begin to notice a flattening or declining ROAS.
So, what’s happening behind the scenes? Each additional investment dollar generates less additional revenue, and revenue grows disproportionately slower despite the continued marketing investment. Eventually, the curve flattens and the law of diminishing returns sets in. Further increases in spend yield very little return, and marketing dollars are wasted in pursuit of harder-to-earn revenue.
A measurable metric like mROAS that quantifies elasticity and diminishing returns empowers marketers to defend their decisions around scaling up or scaling down ad investment in pursuit of maximum revenue efficiency.
How to Calculate mROAS
mROAS calculations require various data points neatly organized in a spreadsheet, though adding a regression modeling tool (like R or Python) gives this metric additional heft. Many mix media modeling (MMM) tools already calculate mROAS during scoring, so consult the below examples to better understand the mechanics of mROAS within the context of your own marketing measurement ecosystem.
Step 1: Collect revenue and spend data
- Quick start: Pull weekly spend and revenue data by channel, channel grouping, or campaign into a spreadsheet. Aim for 1-2 years worth of data.
- More advanced: There are edge cases for channels with shorter- or longer-term conversion windows that would benefit from having revenue and spend grouped with daily or monthly attribution.
Step 2: Calculate mROAS
There are two methods you can pursue to calculate mROAS:
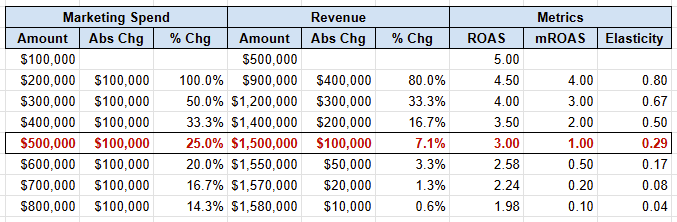
1. Spreadsheet Method: Export weekly results, sort by spend, and calculate for the fields listed out in the example figure below. Find the point in the curve where mROAS = 1, as this represents the point of diminishing returns.
In the hypothetical example below, marketing spend of $500K represents the point of diminishing returns where mROAS = 1. Furthermore, at $500K in marketing spend, the calculated spend elasticity is 0.29, which means that a +1% increase in ad spend results in only +0.29% increase in revenue.
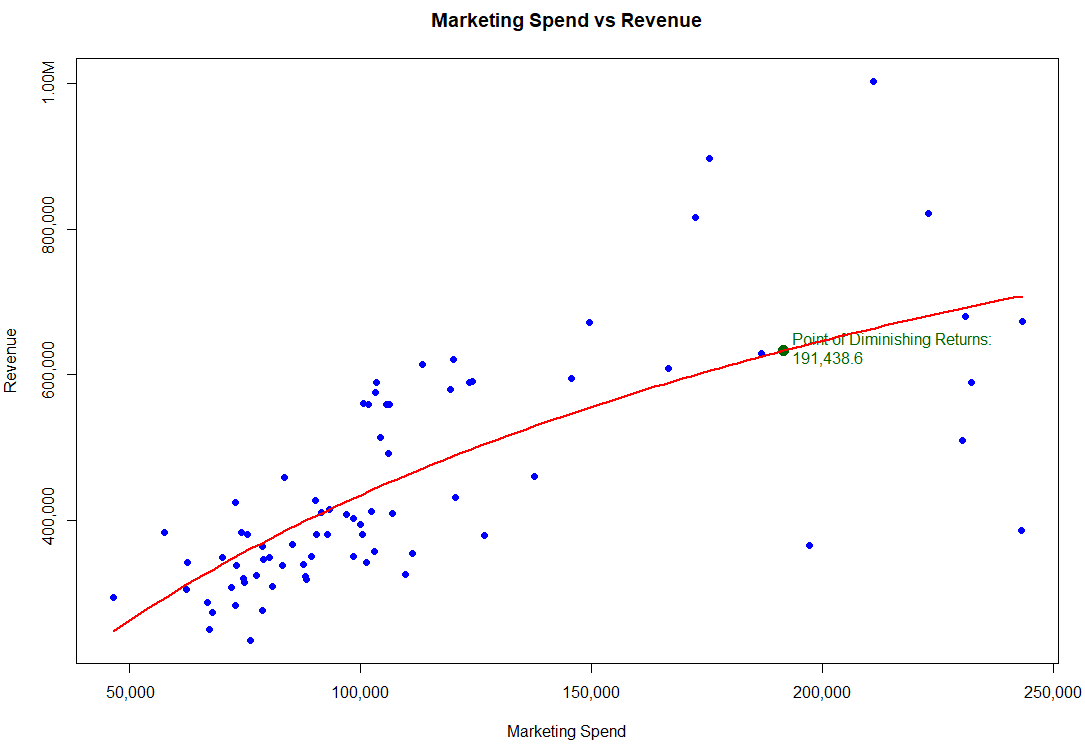
2. Regression Model Method: To account for “real world data,” fit a curve on your dataset. The “Michaelis-Menten” model plots a smooth, continuous function to describe how revenue grows with increases in spend. Other benefits of using this model include predictive insights and the ability to estimate revenue at any spend amount. Using a program like R or Python to converge the curve, export the “Km” term as the point of diminishing returns.
In the hypothetical example below, a non-linear least squares model using nlsLM (“Michaelis-Menten” model) was fit to weekly marketing spend and revenue data. The model plots the point of diminishing returns at $191K, which far exceeds the actual weekly spend average.
Step 3: Evaluate results, prepare insights, and make recommendations
- Find the investment level associated with diminishing returns (where mROAS = 1). Use this point as a guidepost for continued investment in a given channel or campaign.
- If the findings are counterintuitive, evaluate spend above and below this point to build a hypothesis and test varying levels of spend to make a more informed decision.
- Formulas to know:
- mROAS Formula: Δ Abs Revenue / Δ Abs Spend
- Diminishing returns point is where mROAS <= 1. This means that +$1 in marketing spend produces just $1 in revenue (aka the breakeven point).
- Spend Elasticity Formula: % Δ Revenue / % Δ Spend
- Spend elasticity measures how responsive revenue is to changes in ad spend.
- High elasticity means ad spend is efficient, similar to a high mROAS. Low elasticity means ad spend is inefficient, similar to a low mROAS.
- mROAS Formula: Δ Abs Revenue / Δ Abs Spend
From Measurement to Real Impact
In a performance-driven landscape where every marketing dollar must prove its value, mROAS equips marketers with the insights needed to scale spend responsibly and drive efficient growth. But data alone isn't enough. That’s where adMarketplace comes in.
As the largest global marketplace for native search advertising, adMarketplace delivers transparent measurement solutions that enable marketers to not only track media efficiency, but to strategically act on it. Our AMPlify platform provides full visibility into media performance by channel, media segment, and intent type, so you always know how your spend is working out. With dedicated support and access to exclusive native search media, we help advertisers optimize campaigns, validate lift, and avoid wasted spend.
Whether you’re defending your budget, reallocating investment, or planning your next scale-up test, mROAS is a powerful tool—and with adMarketplace, you gain a trusted partner to turn measurement into impact. Reach out today to learn more about how our expert measurement network provides transparent insights into your media value.

Why adMarketplace Native Search Advertising Media?
We help brands maximize reach and improve efficiency so that you can grow market share, outpace competitors, and win the search.
IMPACT 2024
Redefine new possibilities in search advertising.
Sept. 17-18, 2024
Location:
New York, NY